How will my new financial year be?
Can sales developments be foreseen?
We can consult the Oracle!
Or we use some data science magic.
Inhalt
Prediction
There are two types of machine learning predictions: regression and classification
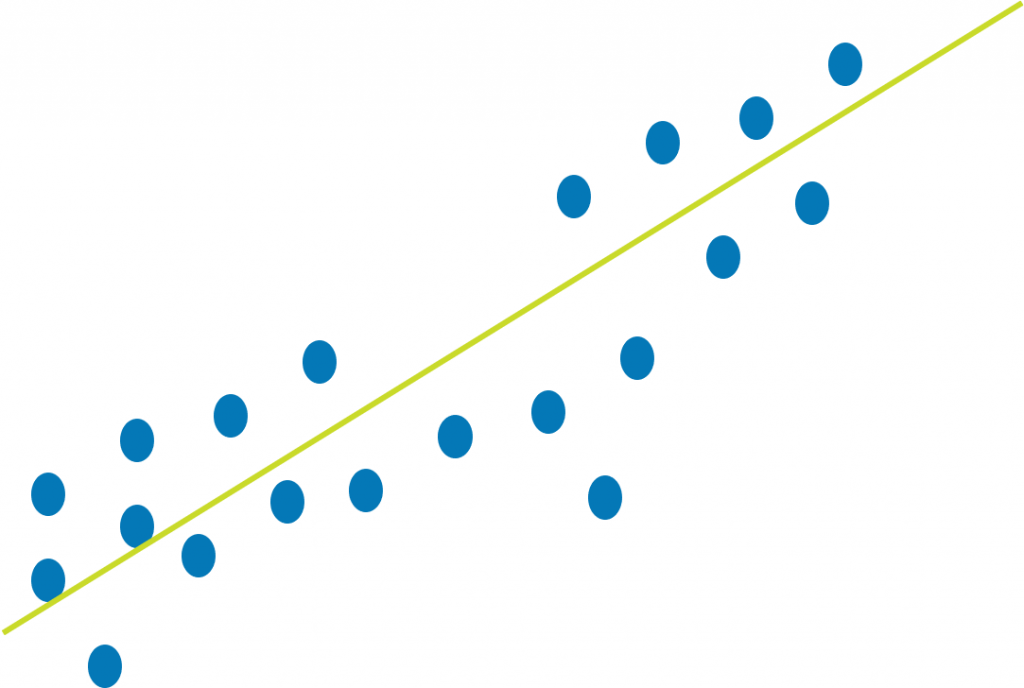
Regression predicts continuous values, so how much?
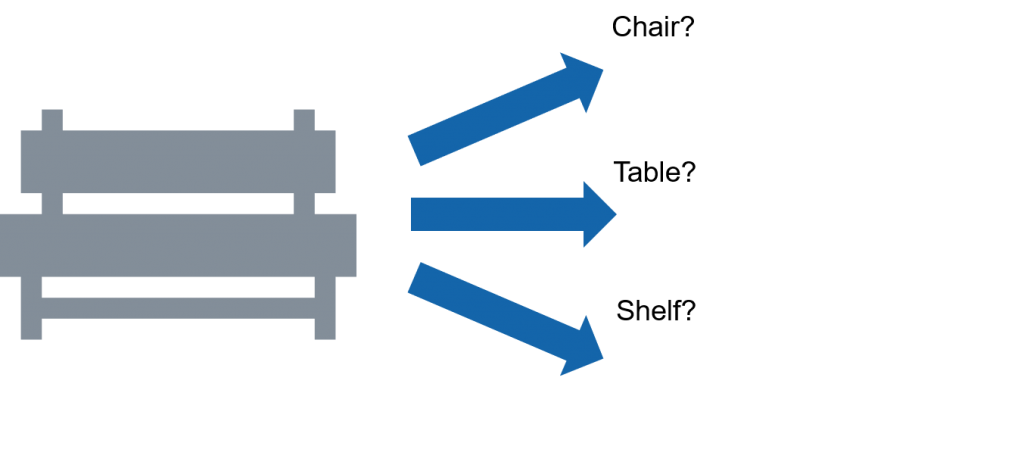
The classification determines a group membership, so what?
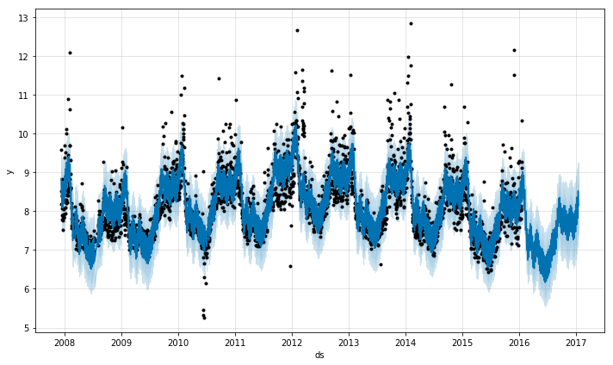
And then there is the time series, values over time, so when and how much?
Machine learning for dummies
Don't you need a data scientist for that?
Eigentlich schon und sie sind hoch geschätzt von mir, aber für sehr einfache Vorhersagen mit wenigen Parametern und guten Grunddaten kann man es durchaus mit fertigen Bibliotheken versuchen – und das ist unsere „Magie“…
Now how does this work?
Quite simple: We send in the existing actual figures for sales development and get a forecast for future figures over time.
Of course, this is not so easy for the machine learning method.
What's really happening?
Various characteristics of the data are examined:
the trend of a longer period,
the seasonality, repeating patterns over time,
cycles of data,
error deviation, etc.
This becomes – only the data scientist knows how – a forecast for each data point in the future.
The solution
Actual figures
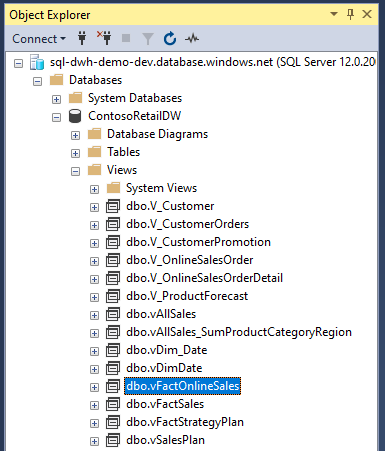
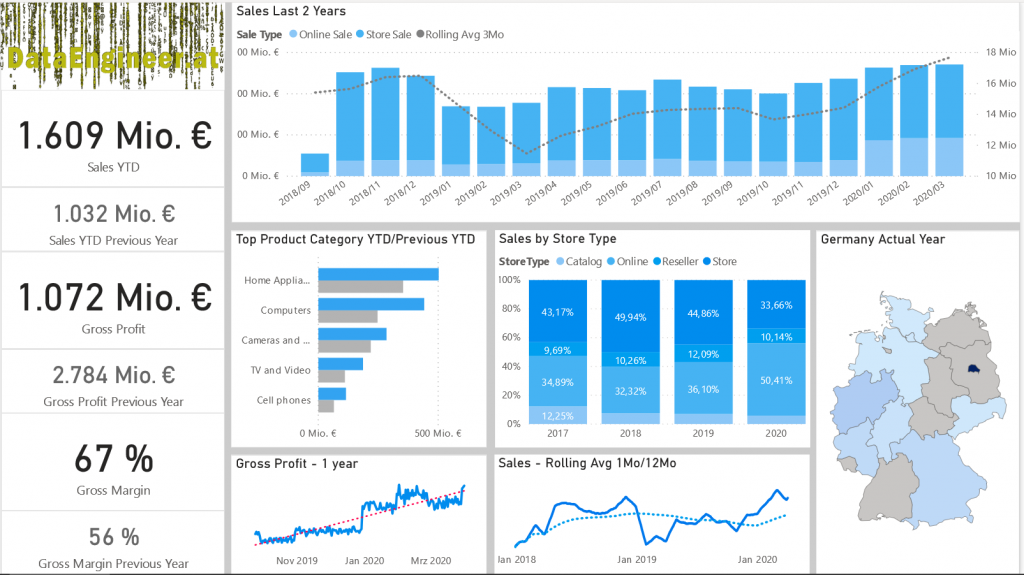
We have a central data warehouse, where we initially have the operative actual figures, with which good reports, e.g. with moving averages can be showed.
Prediction
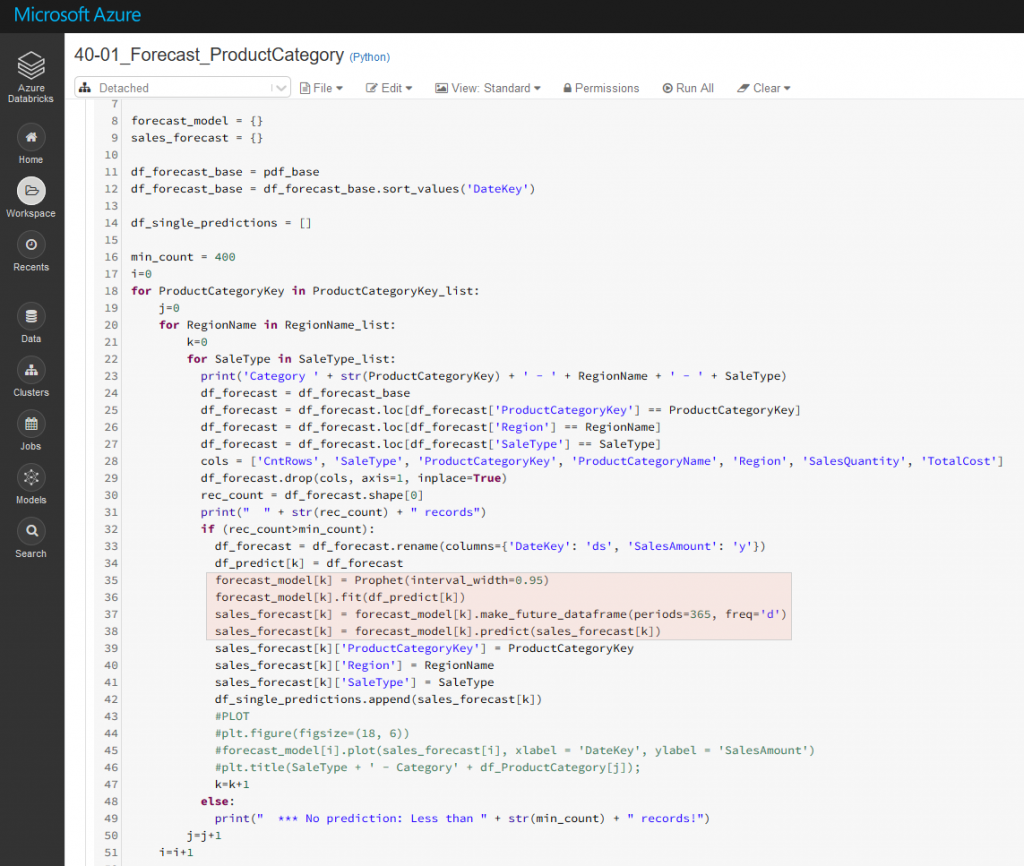
The actual data is processed in Databricks with Spark technology and Python, the predictions are calculated and saved again in our data warehouse.
Since we do not want to evaluate our sales across all areas as a total, differentiation should also be possible according to the type of sale, the product group and the region.
However, this also means that each combination of these must be predicted separately, so this is processed in nested loops, the actual prediction magic happens in just 4 lines.
Report
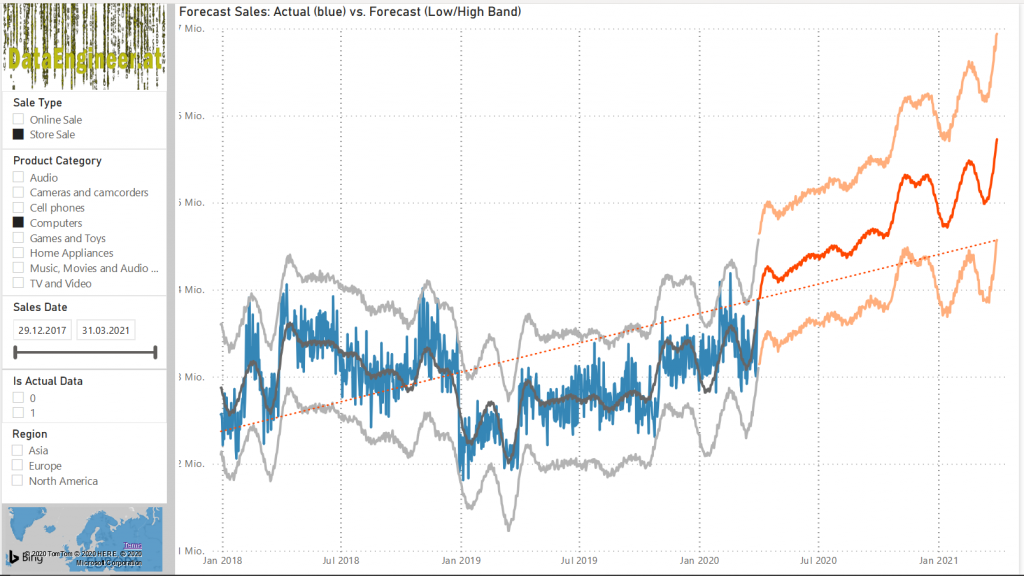
The actual sales can be displayed in a report together with the forecasts and a range of variation.
All combinations of sales type, product group and region can be filtered in any combination.
Planning
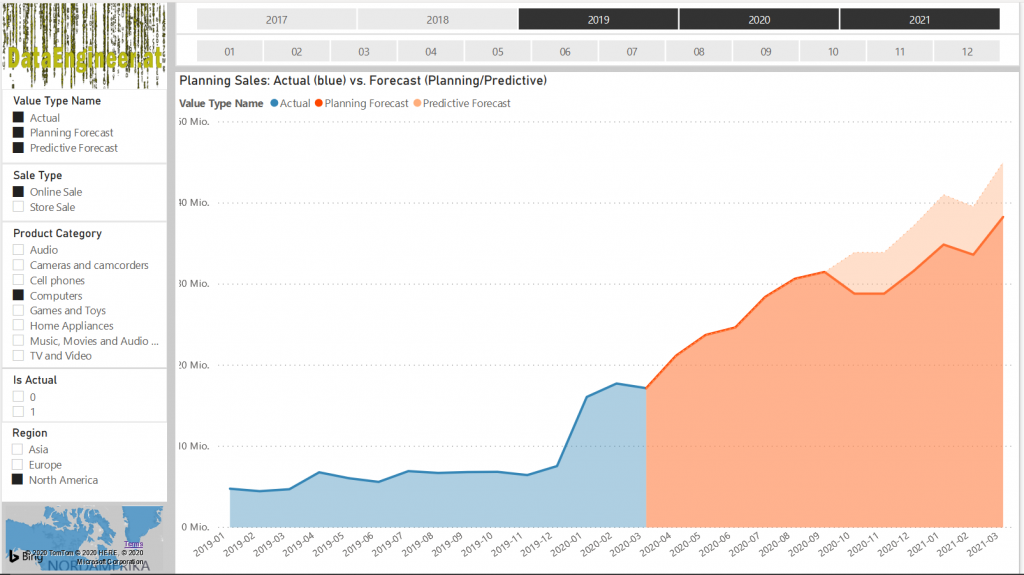
Our forecast already gives a very good impression of the future development of sales, but controlling department certainly knows better what other influencing factors and business developments are pending in the coming year.
In this way, we can not only use the predictive forecast as an outlook, but also as a data basis for planning, on which any adjustments can be made.
Special
If we already have access to the data, we can determine customer segmentation as an additional benefit, for example, in order to get to know our sales based on customer characteristics.
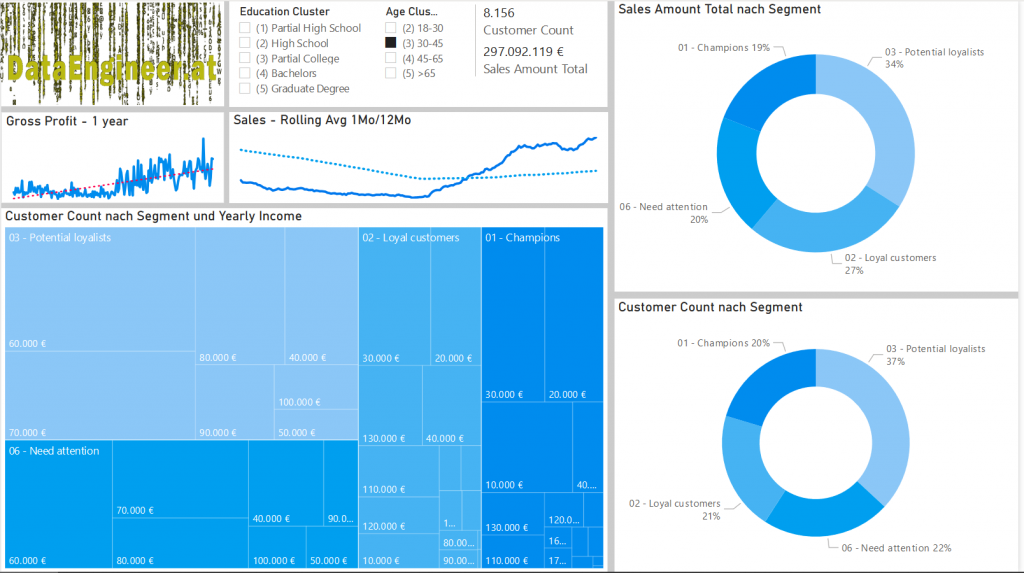
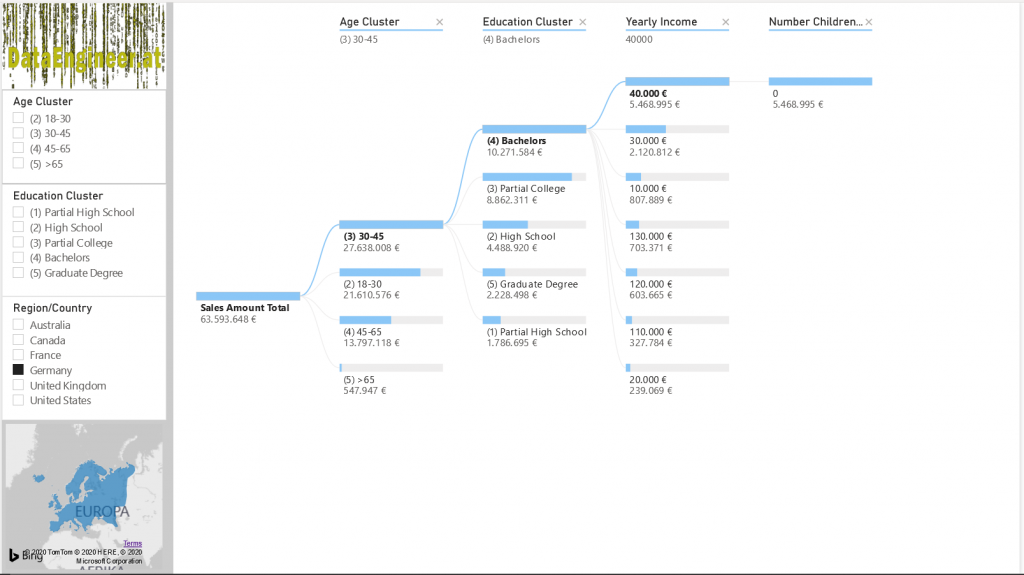
With the AI components in Power BI, further insights about our customers can be determined as an analysis tree and used as a targeted marketing basis.
Cloud architecture
The solution architecture could look like this:
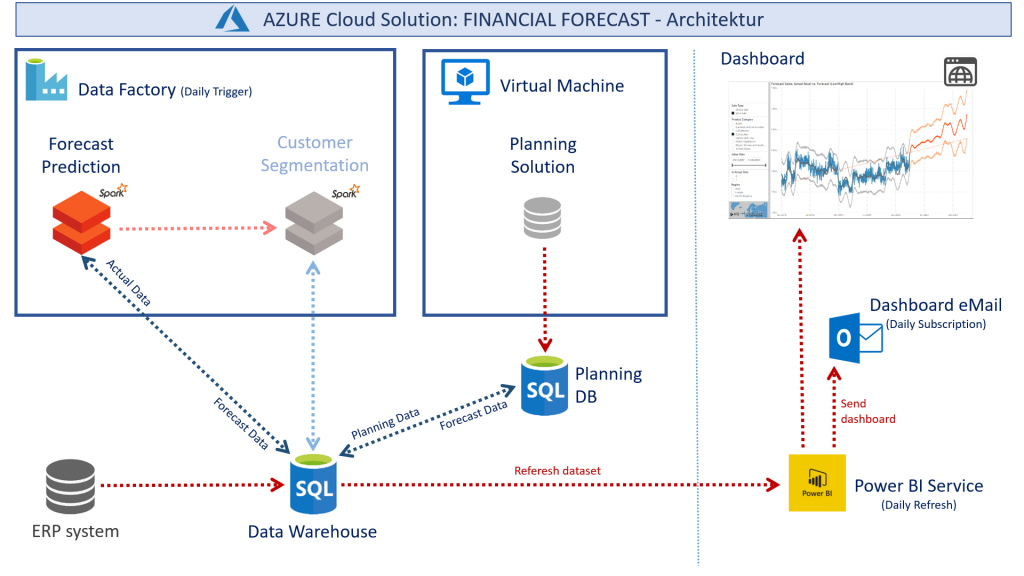
A central data warehouse (Azure SQL) contains all of our necessary operational actual data, which is processed with databricks and the forecast that is determined is saved back to the DWH.
Optionally, a customer segmentation could also be determined with the data.
A planning solution uses the predictive forecast as a basis and stores the planning data in the DWH.
The Azure Data Factory serves as the data process.
Actual data, machine forecasts and planning can now be displayed in Power BI reports and automatically sent as an email if required.
Conclusion
As a relatively simple cloud solution, a financial forecast with a manageable number of parameters and good basic data can add value for future financial figures and the planning process.
Even without deep data science knowledge, useful results can be achieved.
The solution is the usually existing data warehouse with the basic data, which is processed in databricks and a forecast is calculated with prediction libraries, which can also serve as a basis for planning.
All key figures can be displayed and filtered together in a Power BI report.
Share your experience with a comment below!
Leave a comment